Candlestick analysis has long been revered as a cornerstone of successful trading strategies. By understanding the nuances of candle formations and integrating them into a systematic approach, traders can significantly enhance their profitability. In this guide, we delve into a powerful trading system that capitalizes on valid candle formations to exploit market trends effectively.
Valid Candle Formations:
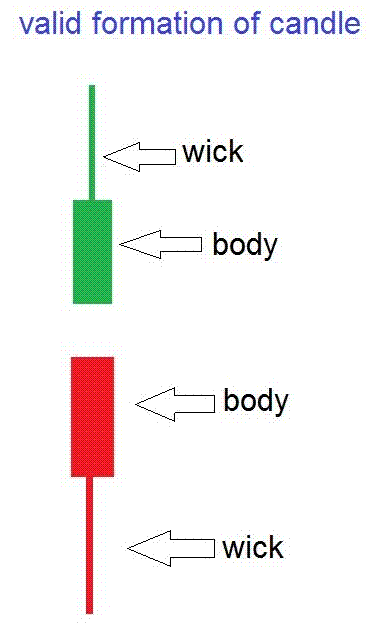
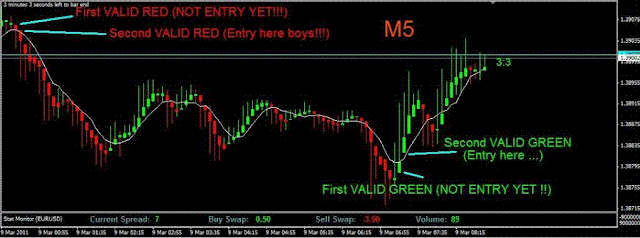
Green Candle: Termed as "Valid Green," indicating bullish momentum.
Red Candle: Referred to as "Valid Red," signaling bearish sentiment.
Invalid Candle Formations:
While specific names aren't assigned, any formation diverging from the valid green or red candles can serve as an exit signal, highlighting potential trend reversals.
Screen Appearance:
"Valid the Trend": A crucial aspect involves scrutinizing the M15 timeframe.
Valid Green indicates an upward trend, while Valid Red suggests a downtrend.
Entry Point/Open Position:
Ensure the absence of wicks in early candlesticks to confirm stability.
Validity of candlestick formations on the M15 timeframe is paramount.
Enhanced validity is achieved when corroborated by M1 timeframe analysis.
Exit Points:
Exit criteria are based on candlestick validity at M1 or M5.
Opt for M1 exit for scalping and M5 exit for swing trading strategies.
Conclusion
Mastering candlestick analysis unveils a powerful arsenal for traders seeking consistent profitability. By adhering to the principles outlined in this strategy, investors can navigate market fluctuations with confidence, leveraging valid candle formations to their advantage. Remember, success lies not only in identifying patterns but also in disciplined execution and risk management.
Mastering candlestick analysis (update 02/2024)
update is a price action trend strategy. I have prepared two templates for this update, 1 for daily time frames (H 15, H 30 and H60, the other for 4 hour and daily time frames).
Indicators:
SR Trend Signal
Filters:
For time frames 15 minutes to 1 hour: filter 1.
For time frames 4 hours and daily: filters 2.
DT Heiken Ashi Candles
Symbol Changer
Trading Rules:Daily Time Frames:
Trade initiation is advisable only when the double circle appears on the chart.
4-Hour and Daily Time Frames:
Consider entering a trade even with a single circle, aligning with the prevailing trend direction.
For Buy and Sell signals, respect the setup of the bars on the chart explained in the previous version.
Buy Signals:
Double green circle on the main chart.
Start buying position in the subsequent bar once the filter transitions to green.
Sell Signals:
Double red circle on the main chart.
Initiate a sell position in the subsequent bar once the filter transitions to red.
Exit Position:
Set stop loss above/below the previous swing high/low to manage risk effectively.
Aim for a profit target of at least 1:1.15 ratio compared to the stop loss.
Conclusion:
By following the prescribed trading rules and leveraging the SR Trend Signal and Heiken Ashi Candles, traders can gain a competitive edge in the forex market. Adherence to disciplined entry and exit criteria, coupled with prudent risk management, forms the cornerstone of consistent profitability. Embrace this strategy as a versatile tool for navigating diverse market conditions and unlocking trading opportunities across multiple currency pairs and time frames.
Download all
https://drive.google.com/drive/folders/1HmvQrq-AfFL0PXTbp-45dN6Yxnm1wBHJ?usp=sharing


إرسال تعليق